Pyblish Plugins Debugging

Hello awesome community and fellow developers,

Debugging is a key part of our everyday tasks, whether we’re troubleshooting a file in production or ironing out issues with a plugin during development.

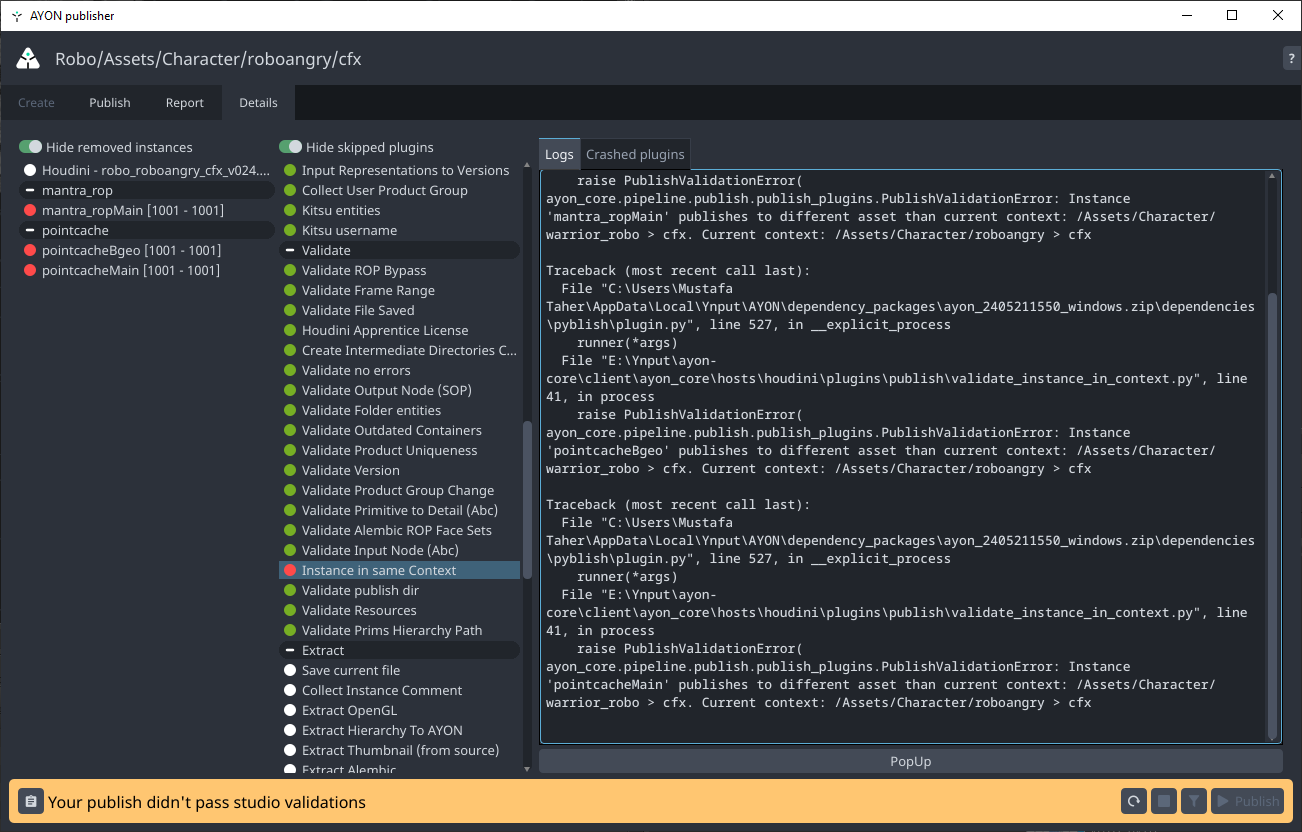
1. Publisher’s Details tab

In the publisher UI, we have a Details tab where you can review the logs for each plugin individually. and you can always add as much log statements as you need.

However, You may find log statements quite limited if you’re looking for deeper insights. For example, understanding the changes in context or determining the execution time of the plugin…

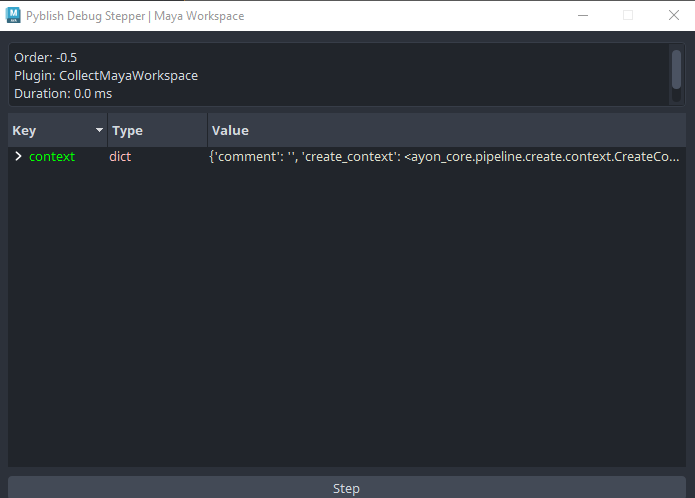
2. Pyblish Debug Stepper

The Pyblish Debug Stepper, developed by @BigRoy, serves precisely this purpose!
It provides a Step-by-Step Debugging, enabling you to examine plugins one at a time. At each step, it shows the context and instances along with their data.

Here’s a quick demo :wink:

Here are some methods to get pyblish debug stepper.

Note: This tool requires pyblish version >= 1.8.12
ayon-dependencies-tool will get it for you automatically once you run it.
Here’s a snippet from the log

Method 1: Copy and Run

You can try it right away.

  1. Copy the code inside pyblish_debug_stepper.py to the script editor in your DCC and run it.
  2. Show the tool window by running inside the script editor.
    window = DebugUI()
    window.show()
    
  3. Trigger the validation or publish from the publisher UI or from code.
  4. Finally, check the output step by step.

Method 2: AYON Experimental Tool

You can do that by checking out my branch feature/add_pyblish_debug_stepper_to_exprimental_tools
Within this branch, I’ve included the Pyblish Debug Stepper as an experimental tool that can be accessed from any Host/DCC.

You can view the changes only through this link:
develop ↔ feature/add_pyblish_debug_stepper_to_exprimental_tools

  1. In terminal in your ayon-core clone:
    git remote add MustafaJafar https://github.com/MustafaJafar/ayon-core.git
    git fetch MustafaJafar feature/add_pyblish_debug_stepper_to_exprimental_tools
    git checkout feature/add_pyblish_debug_stepper_to_exprimental_tools
    
  2. Use ayon-core in dev mode OR create package addon and upload it.
  3. Follow my demo video above!
    Here’s the code snippet mentioned in the video: validate_from_code.py

3. Use Python Debuggers

This one is not much discussed and it has its own caveats.
More info about in comments.

And Keep Tinkering! :wink:

1 Like

The required logic to make this easier has been merged into pyblish-base with Add 'context' key to 'result' dict by MustafaJafar · Pull Request #401 · pyblish/pyblish-base · GitHub which made its way into the 1.8.12 release of Pyblish: Release 1.8.12 · pyblish/pyblish-base · GitHub

It would be great to update the Pyblish dependency in AYON which would make this feature/tool just that - a tool, instead of requiring the other customizations.

1 Like

Cool!

Related question, is there a typical workflow that others use for debugging plugins in their preferred IDE (PyCharm, VSC etc)?

From what I see, the only change needed to get this working (unless I’m mistaken - please point out!) is to compile the py file content prior to six.exec_ in pyblish.plugin.discover.

For example:

with open(abspath, 'rb') as f:
    source = f.read()
    code = compile(source, abspath, 'exec')
    six.exec_(code, module.__dict__)

Apologies if this is a stupid question, or perhaps not the best place.

Thanks,
Lee

I believe actually since some code changes in Pyblish and upgrades to Py3 that debuggers should be able to run through Pyblish Plug-ins just fine. It’s been a while ago that I read that somewhere and can’t fidn details about it now.

There was this ancient topic but I definitely do recall running a “remote debug session” with Pycharm and it working fine to set breakpoints inside Pyblish plug-ins. This was maybe a year ago at most.

Hey @ldunham1 ,
Thanks for expanding the topic!


For the first glance, I didn’t get it but the link that BigRoy’s shared explained it to me furtherly.

Summary, quoted from Marcus.
“You see when plug-ins are discovered on disk, they are loaded as a block of text, rather than imported directly. This is how they are able to reload themselves interactively. It’s possible this throws off any debugger.”

one of the replies suggested replacing the mentioned lines above by the following lines. and the debugger worked with that on their end.

try:
    module = imp.load_source(mod_name, abspath)
except Exception as err:
    log.debug("Skipped: \"%s\" (%s)", mod_name, err)
    continue
1 Like

Thanks for the replies both!
I thought I checked on 3.7 and it was still an issue - will try 3.10.

Otherwise, I suggested the compile option purely for ease of integration.
The issue with imp or importlib would be compatibility with python versions.

Out of interest, would there be any functional reason to prefer using an imp/importlib option over the compile?

(For my own sanity :wink:

As far as I know,
exec is used for executing a dynamically created statement or program.
Compile compiles the source into a code which can speed up repeated invocations of the same code with exec or eval.

>>> program = '''
for i in range(3):
    print("Python is cool")
'''
>>> exec(program)
>>> exec(compile(program))  # Compile beforehand

Reference: python - What's the difference between eval, exec, and compile? - Stack Overflow

Anyways, your code snippet seems to do the same thing as pyblish. loading plugins as a block of text. which we suspect is respnosible for throwing of debuggers.

with open(abspath, 'rb') as f:
    source = f.read()
    code = compile(source, abspath, 'exec')
    six.exec_(code, module.__dict__)

This link is interesting

This is likely best asked to Marcus (developer of Pyblish), e.g. on the pyblish forum or pyblish base issues. However, if you do so it might be worth to try and run the debugger again using latest Python. And if it still gives you issues, to then provide the “what you tried” information to pyblish-base issues to raise the questions and the issue you faced.

I recall there having been proposals for changes in the past - and there being accompanying discussions. But for the life of me, I can’t find any now.

1 Like

Yeah, I think the compile embeds the filepath so it can be used during debugging - the functional difference that seems to make it work (my side) as opposed to current implementation.

Thanks, I’ll get some tests done on different versions and post for Marcus if I’m getting the same results.

Thanks again!

2 Likes

@ldunham1 Any progress on your explorations?